Course Guide

How to build a business statistics course: a complete guide for lecturers

A practical, ready-to-adapt guide for designing or refreshing a Business Statistics course. It brings together course positioning, constructively aligned intended learning outcomes, twelve core concepts with teaching notes, a 12-session syllabus, applied simulations, recent readings, case studies and assessment guidance.

What should a Business Statistics course cover?

A Business Statistics course should teach students how to turn business questions into defensible evidence. A strong 12-session sequence moves from data types, measurement, descriptive statistics and visualisation into probability, distributions, sampling, confidence intervals and hypothesis testing, then develops comparison methods, regression, forecasting and decision-making under uncertainty.

The course works well for final-year undergraduate, MSc, MBA and executive cohorts, typically within 24-36 contact hours and about 150-180 notional learning hours. Students should learn to distinguish description from inference, association from causation, statistical significance from managerial importance, and model fit from decision quality. Software should carry the arithmetic so class time can focus on assumptions, interpretation and communication.

Business Statistics course overview

78%

teach Business Statistics, Quantitative Methods or a closely related course

12

sessions as the most common course-design model

74%

taught at undergraduate level

88%

taught at postgraduate level (levels overlap)

64%

offered as core or required; the rest elective or pathway-based

82%

include an applied or experiential component

Why this course matters

Finance
Marketing
Operations
Economics
Management
Business Statistics evidence for decisions
  • Finance
  • Marketing
  • Operations
  • Economics
  • Management

Business Statistics provides a common evidence language across finance, marketing, operations, economics and management, which is why it works both as a core quantitative module and as a foundation for analytics-heavy electives.

Career path fit

Business analyticsFinance riskMarketing analyticsOperationsConsultingGeneral management
  • Business analytics: 10 out of 10
  • Finance risk: 8 out of 10
  • Marketing analytics: 8 out of 10
  • Operations: 8 out of 10
  • Consulting: 7 out of 10
  • General management: 7 out of 10

How well this course prepares students for six role families, scored out of 10. Indicative, based on how directly the concepts map to each path - not a placement statistic.

Typical course structure

  • Data and measurement foundations 15%
  • Descriptive statistics and visualisation 15%
  • Probability and distributions 15%
  • Sampling and estimation 15%
  • Hypothesis testing and comparisons 15%
  • Regression, forecasting and decisions 25%

Who this guide is for

This guide is for professors, lecturers, module leaders, unit convenors, course coordinators and instructors of record designing or refreshing Business Statistics at university or business-school level. It is intended to travel across course, module and unit terminology, and to help with course ownership questions such as credit value, intended learning outcomes, assessment design and assurance-of-learning evidence.

It is especially useful for final-year undergraduate, MSc, MBA and executive education cohorts where students need practical statistical literacy rather than a mathematical-statistics treatment. The guide assumes that software performs most arithmetic while students are expected to frame questions, select methods, challenge assumptions, interpret uncertainty and communicate defensible business conclusions.

What does a Business Statistics course cover?

A Business Statistics course covers the statistical reasoning managers need to move from raw data to evidence. A coherent lifecycle starts with data, measurement and descriptive analysis, then develops probability, distributions, sampling and confidence intervals before moving into hypothesis tests, group comparisons, regression and forecasting. The final stage integrates statistical output with decision thresholds, risk, ethics and communication.

The course should repeatedly separate concepts that students otherwise collapse together: description versus inference, sample precision versus representativeness, association versus causation, statistical significance versus practical importance, in-sample fit versus out-of-sample performance, and prediction versus decision. Students should leave able to choose an analysis, explain its assumptions, quantify uncertainty and defend what the evidence supports as well as what it does not.

The course at a glance

A one-screen planning view. If you are drafting a course or module approval form, most of the design decisions are visible here; the detailed teaching and assessment logic sits below.

Planning area

Suggested approach

Best fit

Final-year undergraduate business degrees, MSc and MBA programmes, executive education, and quantitatively oriented foundation modules for finance, marketing, operations and management.

Typical length

10, 12 or 14 teaching sessions, with 12 as the standard model here. Roughly 24-36 contact hours plus 120-150 hours of preparation, practice and assessment - about 150-180 notional learning hours.

Course role

Often a core quantitative methods or analytics foundation course. It also provides assurance-of-learning evidence for data literacy, analytical reasoning and evidence-based decision-making.

Useful prerequisites

Basic algebra and spreadsheet confidence. Calculus is not required for the course design in this guide. Prior coding is optional.

Main student output

A data-informed management report or decision memo supported by descriptive analysis, inference, regression or forecasting, plus a short technical appendix.

Best assessment fit

One group applied analysis carrying most of the summative weight plus an individual assumptions note, reflection or oral defence that produces attributable evidence. Most courses use two assessment points rather than every format listed later.

Best simulation fit

Financial Statement Analysis after descriptive statistics for individual data interpretation; Portfolio Management after covariance, regression and a short CAPM/Sharpe/mean-variance bridge for an advanced capstone.

Learning outcomes

These intended learning outcomes use assessable verbs and constructive alignment so that each can generate evidence in an assessment task, simulation debrief, model critique or oral defence. Bloom's taxonomy is used once here as a design check: early outcomes establish the language of data and probability, while the later outcomes ask students to analyse, evaluate and defend.

  1. Frame a managerial question as a statistical problem by identifying the decision, variables, population, sample and relevant evidence.
  2. Summarise and visualise business data using appropriate measures of centre, spread, shape, association and uncertainty.
  3. Apply probability rules and common probability distributions to quantify uncertainty in business settings.
  4. Evaluate sampling designs, sampling distributions and sources of bias before drawing conclusions from sample data.
  5. Construct and interpret confidence intervals for business parameters while explaining the effect of sample size and variability on precision.
  6. Conduct and interpret hypothesis tests without reducing conclusions to a mechanical p-value threshold.
  7. Compare groups using appropriate tests for means, proportions and counts, including t-tests, chi-square methods and one-way ANOVA where suitable.
  8. Estimate and critique simple and multiple regression models, including coefficients, residuals, diagnostics, prediction intervals and key assumptions.
  9. Produce and compare forecasts using suitable time-series methods, back-testing and forecast-error measures.
  10. Defend a data-informed business recommendation by integrating statistical evidence, model limitations, practical significance, ethics and uncertainty.

Core concepts

The structure reflects patterns commonly seen in Ivy League and leading global business-school courses on Business Statistics, quantitative analysis and business analytics. For example, current Harvard and Wharton offerings emphasise data description, probability, inference, regression, software-assisted interpretation and critical evaluation of assumptions. This is a course-design pattern rather than a claim that every leading school teaches the same syllabus.

There are twelve core concepts in this Business Statistics course. They build from asking a statistically answerable question through description and uncertainty to inference, modelling, forecasting and final decision judgement.

1. Data, measurement and business questions

2. Descriptive statistics and data visualisation

3. Probability and conditional probability

4. Random variables and probability distributions

5. Sampling, sampling distributions and the central limit theorem

6. Estimation and confidence intervals

7. Hypothesis testing and statistical significance

8. Comparing groups: t-tests, chi-square and ANOVA

9. Correlation and simple linear regression

10. Multiple regression, diagnostics and model interpretation

11. Time series, forecasting and uncertainty

12. Statistical decision-making, risk, ethics and communication

Concept Details

The notes below are lecturer-facing teaching components rather than textbook chapters. Each concept contains a central question, coverage, learning outcomes, teaching approach, a runnable fictional case with data, a difficulty to watch for, a reading check and an applied bridge.

Connecting the concepts

This alignment map keeps the course from becoming a sequence of disconnected techniques. Each stage leaves behind a formative output that can be reused in the final summative decision report. The assessment evidence therefore accumulates across the course rather than appearing only at the end.

Stage of statistical work

Principal concepts

Expected student output

Frame the question

Data, measurement and business questions (1)

Analysis plan, data dictionary and statement of the population and sample.

Describe the evidence

Descriptive statistics and visualisation (2)

Decision-relevant charts and numerical summary with commentary.

Model uncertainty

Probability and distributions (3-4)

Probability model, expected value and risk interpretation.

Move from sample to population

Sampling and confidence intervals (5-6)

Sampling critique, interval estimate and precision statement.

Test and compare

Hypothesis tests and group comparisons (7-8)

Test result with effect size, uncertainty and practical interpretation.

Model relationships

Regression and diagnostics (9-10)

Regression model, diagnostic appendix and prediction with limitations.

Forecast and decide

Forecasting and decision judgement (11-12)

Forecast or capstone recommendation, sensitivity analysis and individual defence.

Software calculates. Students frame, choose, interpret, challenge and decide.

Mark the quality of the question, the assumptions behind the method, the uncertainty in the estimate and the decision logic. A flawless calculation with a weak question or unsupported interpretation should not outscore a less polished analysis that identifies the real limitation and explains what would change the conclusion.

Adapting for undergraduate and postgraduate students

The architecture can stay stable across final-year undergraduate, MSc, MBA and executive cohorts. What changes is scaffolding, software independence and tolerance for ambiguity. Undergraduates should not receive a narrower list of topics simply because they have less experience. Give them cleaner data, explicit questions and structured outputs. Postgraduate students can be given messier data, conflicting objectives and fewer instructions about which method to choose.

A 12-session version typically fits 24-36 contact hours and about 150-180 notional hours. In shorter executive formats, preserve the sequence from question to evidence to decision but reduce technical breadth and increase case discussion.

Course design area

Undergraduate version

Postgraduate / MBA / executive version

Course emphasis

Build statistical language, method choice and interpretation with tightly structured datasets.

Move faster into ambiguous data, model critique, incomplete information and decision defence.

Mathematical depth

Use formulas to explain structure, but let software handle arithmetic.

Add derivations selectively where they deepen assumptions, not as a gatekeeping exercise.

Software

Excel, JMP, SPSS or guided R/Python notebooks can all work.

Require reproducible workflows, scripted analysis or versioned notebooks where appropriate.

Regression

Focus on coefficients, residuals, prediction and causal caution.

Add interactions, model comparison, cross-validation, limited causal inference and modern prediction.

Forecasting

Use simple baselines, smoothing and holdout evaluation.

Add rolling validation, forecast combinations or uncertainty forecasting.

Reading load

Textbook chapters, short applied articles and structured case questions.

Add journal articles on significance, prediction, forecasting, ethics and machine learning.

Assessment

Structured analysis report with specified methods plus individual interpretation.

Open-ended decision memo, reproducible appendix and oral defence under challenge.

Simulation use

Use FSA as a guided individual exercise; use Portfolio Management only with extra finance preparation.

Use Portfolio Management as a capstone after a finance bridge, with stronger emphasis on assumption defence and risk-adjusted outcomes.

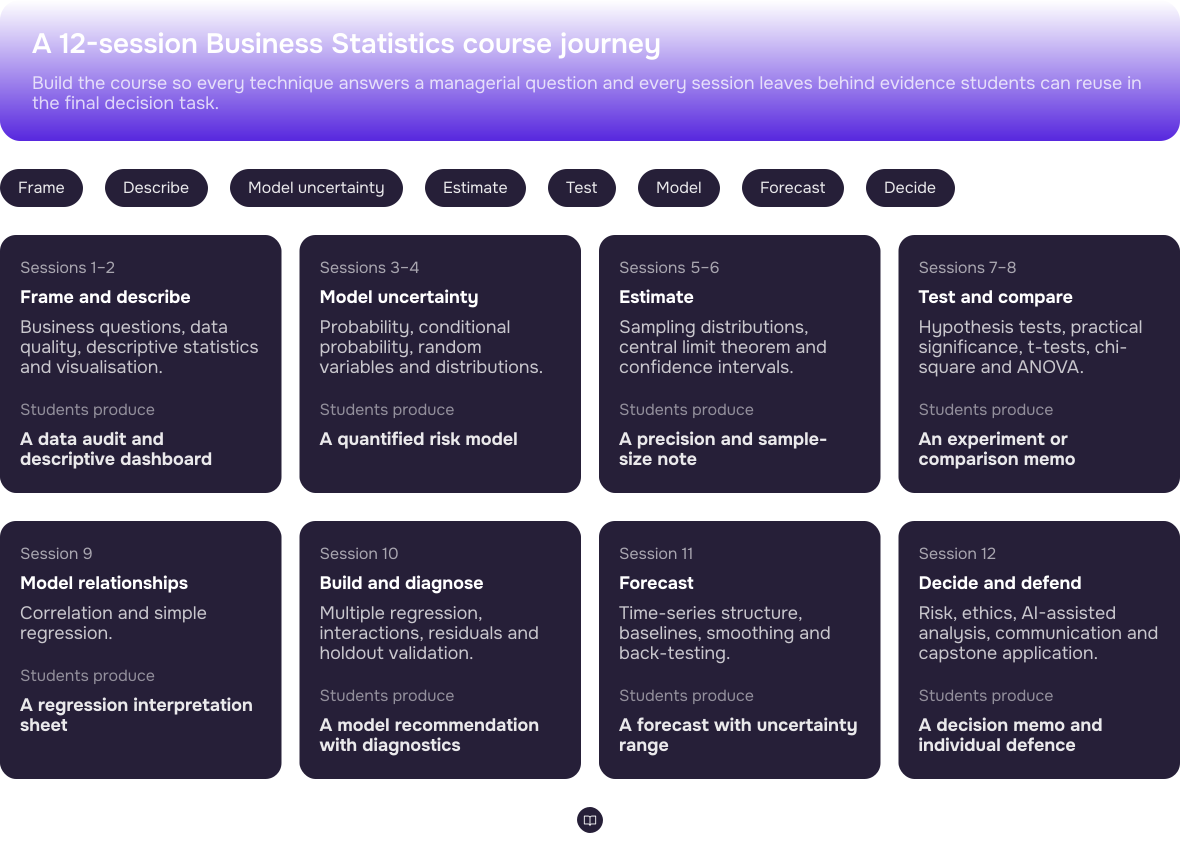
The 12-session syllabus

The syllabus follows the statistical reasoning lifecycle: define the question and data, describe what is observed, model uncertainty, infer from samples, compare evidence, build predictive relationships, forecast and finally convert the evidence into a decision. The design principle worth keeping if you change nothing else is to make every session produce something markable.

The sequence matters more than the software: questions first, uncertainty second, methods third, decisions last.

Detailed 12-session syllabus

Session

Topic

Teaching focus

Student activity

Best-fitting simulation, where relevant

Assessment or output

1

Data, decisions and measurement

Frame managerial questions statistically; variables, populations, samples, data sources and data quality.

Audit a short business dataset and write an analysis plan.

Data dictionary and one-page analysis plan.

2

Describing and visualising business data

Categorical and quantitative summaries, outliers, skewness, segment comparisons and chart choice.

Create a concise descriptive dashboard and executive interpretation.

Financial Statement Analysis (optional application)

Descriptive analysis note with two decision-relevant charts.

3

Probability and conditional probability

Probability rules, conditional probability, independence, Bayes-style updating and base rates.

Evaluate a fraud or screening rule under asymmetric error costs.

Risk-screening recommendation.

4

Random variables and probability distributions

Expected value, variance, binomial, Poisson and normal models; distributional assumptions.

Model uncertain demand or defects and test alternative assumptions.

Probability model memo.

5

Sampling and sampling distributions

Sampling designs, bias, standard error, central limit theorem and large-sample limits.

Compare a random sample with a large convenience sample and defend which estimate is usable.

Sampling design critique.

6

Estimation and confidence intervals

Confidence intervals for means and proportions; margin of error; sample-size planning.

Build an interval around a business KPI and recommend whether the estimate is precise enough.

Precision and sample-size note.

7

Hypothesis testing and practical significance

Null and alternative hypotheses, error types, p-values, effect sizes and power.

Test a business claim and write a conclusion that separates statistical from practical significance.

Hypothesis-test decision brief.

8

Comparing groups and experiments

Two-sample methods, paired designs, chi-square, one-way ANOVA and multiple-comparison risk.

Analyse an experiment and compare conclusions across outcome types.

Experiment analysis memo.

9

Correlation and simple linear regression

Correlation, least squares, coefficient interpretation, residuals, R-squared, inference and prediction.

Estimate a simple regression, inspect residuals and challenge a causal interpretation.

Regression interpretation sheet.

10

Multiple regression and model diagnostics

Conditional coefficients, dummy variables, interactions, multicollinearity, omitted variables and holdout validation.

Build and compare two models using a train-holdout structure.

Model recommendation and diagnostics appendix.

11

Time series and forecasting

Trend, seasonality, moving averages, smoothing, back-testing, forecast error and prediction intervals.

Compare a naive forecast with two alternatives on a holdout period.

Forecast recommendation with uncertainty range.

12

Decision analytics, risk and statistical communication

Decision thresholds, sensitivity, ethics, fairness, AI-assisted analysis and executive communication.

Defend a data-informed recommendation under challenge.

Portfolio Management (capstone with finance primer)

Capstone decision memo plus individual oral or written defence.

Simulations: What they are and why they belong in this course

Business Statistics is a decision subject disguised as a quantitative subject. Students can learn procedures from worked examples, but the deeper skill is deciding what to measure, which method is defensible, whether assumptions are credible, how much uncertainty matters and whether the result changes a management decision.

Applied simulations belong after the relevant statistical concepts because they make model outputs compete with incomplete information, role objectives and changing evidence. For this course, the strongest fit is selective rather than universal: Financial Statement Analysis works as an accessible individual interpretation exercise, while Portfolio Management is a more advanced capstone only after students receive the finance concepts the live product requires.

There is also an accreditation argument. Experiential work can create observable evidence that students can apply and evaluate rather than only recall, provided the lecturer uses a structured debrief and an attributable assessment component. If you need the accreditation language itself, what AACSB and AMBA say about simulations sets it out.

Traditional case study vs simulation

Teaching format

What it does well

Limitation

Best use in this course

Traditional case study

Provides a rich dataset or decision context and lets students slow down the reasoning.

Students can discuss the answer without having to update a live decision.

Best for hypothesis testing, experiment design, regression, model critique and forecasting.

Simulation

Makes students apply quantitative evidence to visible choices and compare outcomes with peers or other teams.

Requires careful prerequisite checking and a debrief; otherwise students may remember the activity rather than the statistical reasoning.

Best for data interpretation, risk-return decisions, rebalancing, evidence updates and defence of judgement.

A simulation is not a substitute for teaching the method. Use it after students hold enough concepts to explain why their decision changed and what the numbers did not resolve.

Where simulations fit

For Business Statistics, the two simulations play different roles. Financial Statement Analysis is the lower-prerequisite application because the live simulation is beginner accessible and single-player. Portfolio Management is the stronger quantitative capstone, but its live page explicitly requires basic CAPM, Sharpe Ratio and mean-variance optimisation, so a statistics lecturer should add that bridge rather than assume the course already covers it.

Course point

Simulation

How to use it

Why it fits

After Session 2: descriptive statistics and trend interpretation

Financial Statement Analysis

Use as a 2-3 hour individual workshop or split across sessions. Students calculate ratios, interpret trends across reporting periods and update a judgement as new information arrives.

Beginner accessible and produces individual evidence. It reinforces data interpretation and updating rather than formal financial forecasting.

After Session 9 or 10: covariance, regression and model interpretation

Portfolio Management

Use only after adding a short finance primer on CAPM, Sharpe Ratio and mean-variance optimisation. Teams then analyse historical data, construct portfolios and rebalance across changing market information.

Directly applies expected return, beta, covariance, volatility, optimisation and risk-adjusted performance, but the finance prerequisites need to be explicit in a Business Statistics course.

AI impact on Business Statistics teaching

Generative AI changes the assessment signal in Business Statistics because it can draft code, suggest tests, explain output and produce charts quickly. The lecturer therefore needs stronger evidence that the student chose the method for the right reason, checked assumptions, used an appropriate validation design and can defend the conclusion under questioning.

A practical permitted-use policy is usually clearer than silence. AI can be allowed for coding support, debugging, structure and language improvement if students declare its use, verify all outputs and remain responsible for every analytical choice. Credit should shift from polished syntax toward the statistical question, evidence quality, model limitations, sensitivity and decision defence.

How AI is changing the subject

Students can now move from a natural-language request to a chart, test or regression model in seconds. That makes statistical literacy more important, not less. The scarce skill is recognising when the proposed analysis is inappropriate, when a result is fragile, when a causal claim exceeds the design and when an apparently precise answer is based on poor data.

Implications for teaching and assessment

Teaching area

AI implication

Lecturer response

Descriptive analysis

AI can produce polished summaries and charts quickly, sometimes without checking definitions or denominators.

Require a reproducible data dictionary, a chart rationale and a short statement of what the display does not establish.

Hypothesis testing

AI can select and run a test, but may misread the design or report “no effect” from non-significance.

Mark method choice, effect size, interval and error costs rather than the p-value alone.

Regression

AI can generate model code and commentary, but can invent causal language or ignore diagnostics.

Require students to defend variable choice, assumptions, residual checks and whether the goal is prediction or explanation.

Forecasting

AI can suggest methods, but can leak future information or choose a model without a realistic back-test.

Require a time-respecting holdout and a baseline forecast.

Written reports

AI can make weak analysis sound authoritative.

Shift credit toward evidence selection, assumptions, uncertainty, source verification and oral defence.

Recommended Readings

Core textbook: Norean R. Sharpe, Richard D. De Veaux and Paul F. Velleman, Business Statistics, 4th edition, Pearson, published 2023. It is a strong fit because it explicitly emphasises business decisions, interpretation over hand calculation, real business contexts and a sequence from data through probability and inference to regression, time series, analytics and decision risk.

Alternative textbook: Jeffrey D. Camm, James J. Cochran, Michael J. Fry, Jeffrey W. Ohlmann, David R. Anderson, Dennis J. Sweeney and Thomas A. Williams, Statistics for Business & Economics, 15th edition, Cengage, 2024 copyright edition. The publisher describes more than 350 updated business examples and support for Excel, JMP and R.

Foundational readings worth assigning directly:

All eight directly assigned readings are after 2015. Five are from 2022-2026, with the remaining three retained because they address enduring issues in prediction, machine learning and the interpretation of statistical significance.

Real case studies to use

Use two verified cases to complement the fictional seminar cases in the Concept Details. Together they provide strong applications for hypothesis testing and regression while keeping the section concise.

Case 1

Testing Marketing Hypotheses at WSES

Author(s): U Dinesh Kumar

Publisher: Indian Institute of Management Bangalore / Harvard Business Publishing Education. Year: 2018, revised teaching materials later.

Why it fits: A six-page case designed for statistical analysis in quantitative techniques, data science and business analytics. It is well placed after hypothesis testing because students must select and interpret tests in a real marketing setting.

Best placement: Sessions 7-8

Assessment fit: Short analysis memo with method choice, result, practical interpretation and limitation.

View case study

Case 2

Flipkart: Leveraging Customer Analytics

Author(s): Ron Wilcox, Bianca Kemp & Thomas Adkins

Publisher: Darden School of Business / HBR Store. Year: 2025.

Why it fits: A field-based retail case with a student spreadsheet. The product description notes that multiple regression is the most sophisticated tool, making it a strong fit for translating model output into promotional decisions.

Best placement: Session 10

Assessment fit: Group regression recommendation plus individual coefficient and diagnostics interpretation.

View case study

Sample session plan: multiple regression for a business decision

Best placement: Session 10. Session aim: move students from reading regression output to building, diagnosing and defending a multivariable model for a real managerial choice.

Session stage

Time

Lecturer approach

Student output

Pre-class preparation

Before class

Give students a short regression reading, the Flipkart case spreadsheet or an equivalent dataset, and a one-page prompt asking for the managerial decision, outcome variable and candidate predictors.

One-page preparation note identifying the decision, outcome and three candidate predictors.

Opening frame

10 minutes

Ask the central question: “What would make this regression useful for a promotion decision rather than merely statistically significant?”

Students state a decision threshold and one causal caveat.

Mini-lecture

20 minutes

Review conditional coefficient interpretation, dummy variables, interactions, multicollinearity, residuals and holdout validation.

Annotated model-output sheet.

Model build

35 minutes

Teams build a base model and one alternative. They must justify every added variable before seeing its p-value.

Two model specifications with rationale.

Diagnostics and holdout test

25 minutes

Students inspect residuals, compare in-sample fit with holdout error and identify one limitation that could change the recommendation.

Diagnostics appendix and holdout comparison.

Managerial recommendation

20 minutes

Each team writes a five-sentence recommendation translating coefficients into a promotion decision, with one uncertainty statement.

Short management memo.

Challenge

20 minutes

Challenge each team on causality, omitted variables, model stability and practical significance.

Individual oral defence or short written response.

Debrief

15 minutes

Compare which models were simpler, more stable and easier to explain, then ask what evidence would be needed before using the model in production.

Individual reflection on one model choice they would change.

Why this session matters: it makes the course's central distinction visible. Software can fit a model quickly; the student must still justify the variables, challenge the assumptions, test performance and translate the result into a decision.

Assessment options for a Business Statistics course

The intended learning outcomes reward judgement rather than formula recall, so assessment should ask students to recommend and defend. A common defensible pattern is one group applied output carrying most of the summative weight plus an individual assumptions note, reflection or oral defence that produces attributable evidence, subject to local regulations. Use the table as a menu, not a requirement to use every item.

Assessment option

Indicative weighting

Evidence type

What it assesses

Data analysis report

30-40%

Group

A reproducible descriptive/inferential analysis of a business dataset with charts, method rationale and management recommendation.

Individual assumptions and limitations note

15-20%

Individual

A short note explaining sampling limits, assumptions, practical significance and what evidence would change the conclusion.

Regression or forecasting project

25-35%

Group or individual

A model built on a train/holdout structure with diagnostics, error metrics and a decision recommendation.

Oral defence / viva

10-20%

Individual

Five to ten minutes of questioning on method choice, interpretation, uncertainty and causal limits.

Simulation analysis

10-20%

Group or individual depending on simulation

A pre-brief, decision record, debrief and reflection that connects simulation choices to statistical concepts.

Common mistakes when teaching Business Statistics

The strongest courses do not make statistics a sequence of calculator recipes. They repeatedly ask what the evidence supports, what the method assumes and how the result changes a business decision.

Common mistake

Why it weakens the course

Better approach

Teaching formulas before questions

Students learn procedures but cannot decide which analysis belongs to a managerial problem.

Start every method with the decision, population, outcome and evidence needed.

Using software as a black box

Output looks authoritative even when the method or coding is wrong.

Mark method choice, assumptions and interpretation explicitly.

Over-rewarding p-values

Students learn that “significant” means important and “not significant” means no effect.

Require effect sizes, intervals and practical decision thresholds.

Ignoring sampling bias because n is large

Large biased datasets can look more precise than representative smaller samples.

Separate precision from representativeness in every sampling exercise.

Treating correlation as causation

Students convert observational slopes into managerial interventions.

Ask what design would support a causal claim and what confounders remain.

Optimising R-squared

Students add weak variables and produce unstable, hard-to-explain models.

Use holdout validation, diagnostics and parsimony.

Randomly splitting time-series data

Future information leaks into model development and makes performance look better than it is.

Use rolling or forward holdouts for forecasting.

Making every session a calculation lab

Students can compute but cannot communicate or defend a result.

Make each session produce a decision sentence, limitation and challenge question.

Using simulations without prerequisite checks

Students may enjoy the activity but cannot connect outcomes to the statistics.

Place simulations after relevant theory and state any extra bridge concepts, especially CAPM and Sharpe Ratio for Portfolio Management.

Assessing only group output

Free-riding can hide who can interpret and defend the analysis.

Add an individual assumptions note, reflection or oral defence and use it in moderation.

Frequently asked questions

These questions cover subject design first, then operational delivery and copy-paste utility for course approval, module handbooks and assessment briefs.

Related course guides and teaching resources

Corporate Finance Course Guide

For courses where statistical evidence feeds valuation, capital budgeting, capital structure and financial planning.

Investment Banking Course Guide

For transaction analysis, valuation evidence and communicating quantitative recommendations.

Mergers & Acquisitions Course Guide

For applying data analysis to transaction rationale, valuation ranges and deal decisions.

Entrepreneurship Course Guide

For uncertainty, forecasting and evidence-based financing decisions in high-growth companies.

Portfolio Management Simulation

Use after covariance, regression and the added portfolio-theory primer to apply risk-return analysis.

View simulation

Financial Statement Analysis Simulation

Use after descriptive statistics for individual evidence on trend interpretation and updating judgement.

View simulation

Next steps for your module

Use the guide as a design scaffold rather than a fixed syllabus. Start with the intended learning outcomes, choose the 10-, 12- or 14-session structure that fits your calendar, select two assessment points and then decide where an applied simulation adds evidence you could not obtain as clearly from a normal worksheet.

Plan the course

Adapt the syllabus

Copy the 12-session structure into your course or module template, then adjust examples, datasets, software and contact hours to local requirements.

Align assessment

Choose the evidence

Pair one integrated group analysis with an attributable individual component so moderation and assurance-of-learning evidence remain defensible.

Applied learning

Getting started with your first simulation

Use Financial Statement Analysis for an accessible individual application, or Portfolio Management later in the course after the required finance bridge.

Delivery

How to operate the simulator

Set up participants, confirm prerequisites, configure timings, brief students on the decision and reserve time for a structured debrief that reconnects outcomes to the statistical concepts.

Request information

Request more information

Share your course level, cohort size, session length and the concepts you want students to apply. Finsimco can help identify the most defensible simulation placement.

Request information

Request more information

Book a Demo

Book a demo

See how the professor dashboard, student experience, timing controls and evidence outputs work before deciding how to place a simulation in your Business Statistics course.

Book a demo