Three-statement analysis
Analyse the Income Statement, Balance Sheet and Cash Flow Statement.

Financial Statement Analysis Simulation
Students analyse the Income Statement, Balance Sheet and Cash Flow Statement, calculate and interpret profitability, liquidity, efficiency and solvency ratios, and use their findings to form a share price prediction.
The simulation applies core Financial Statement Analysis concepts in sequence. Students connect the three financial statements, calculate and interpret key ratios, then reassess company performance across five reporting periods before forming a supported share price prediction.
Analyse the Income Statement, Balance Sheet and Cash Flow Statement.
Calculate profitability, liquidity, efficiency and solvency ratios
Review five periods of updated financial information and company reports.
Duration
Run the simulation in one workshop or divide it across teaching sessions.
Format
Each student participates as a Financial Analyst and submits their own decisions.
Level
Works as first applied exposure for undergraduates and as a diagnostic warm-up before valuation teaching at postgraduate level.
Professor tools
Control the timeline, manage participants, review inputs and send class alerts.
Prerequisites
Suitable for beginners, with video guidance, case information, task checklists, pop-ups and tooltips.
Delivery
The simulation is web-based and supports different teaching formats.
Assessment
Use submissions, scores, rankings and reflection outputs as supporting evidence.
Course fit
Designed for Financial Statement Analysis, Financial Accounting, Financial Reporting, Corporate Finance, Business Finance teaching.
Turning reported numbers into a clear, evidence-based judgement about financial health, performance and future prospects.
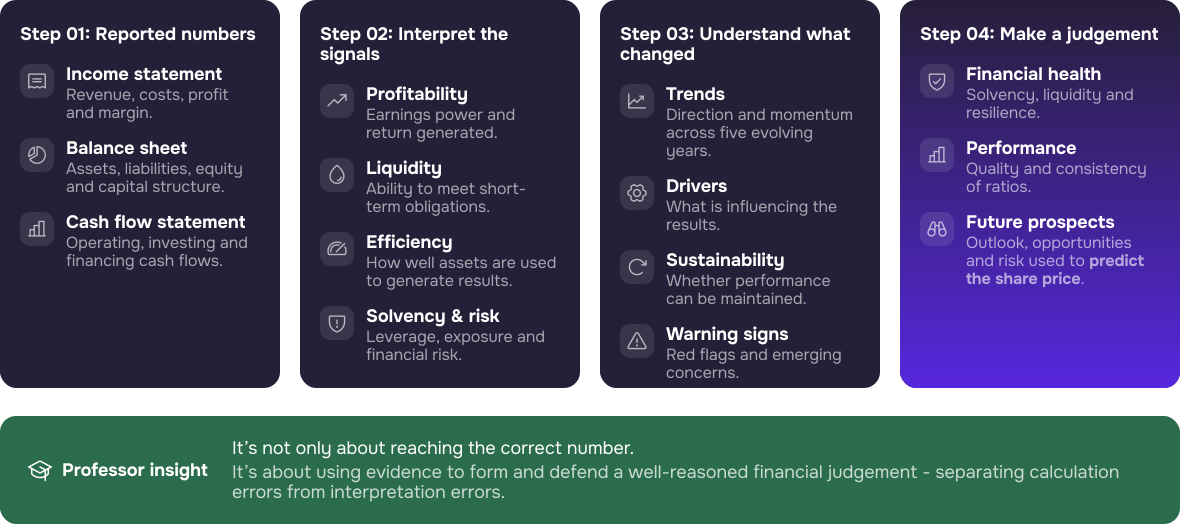

Students must draw evidence from the Income Statement, Balance Sheet and Cash Flow Statement rather than treating each item as an isolated topic.
Submitted calculations, evaluation choices and share price predictions show whether students can move from a numerical result to a meaningful financial judgement.
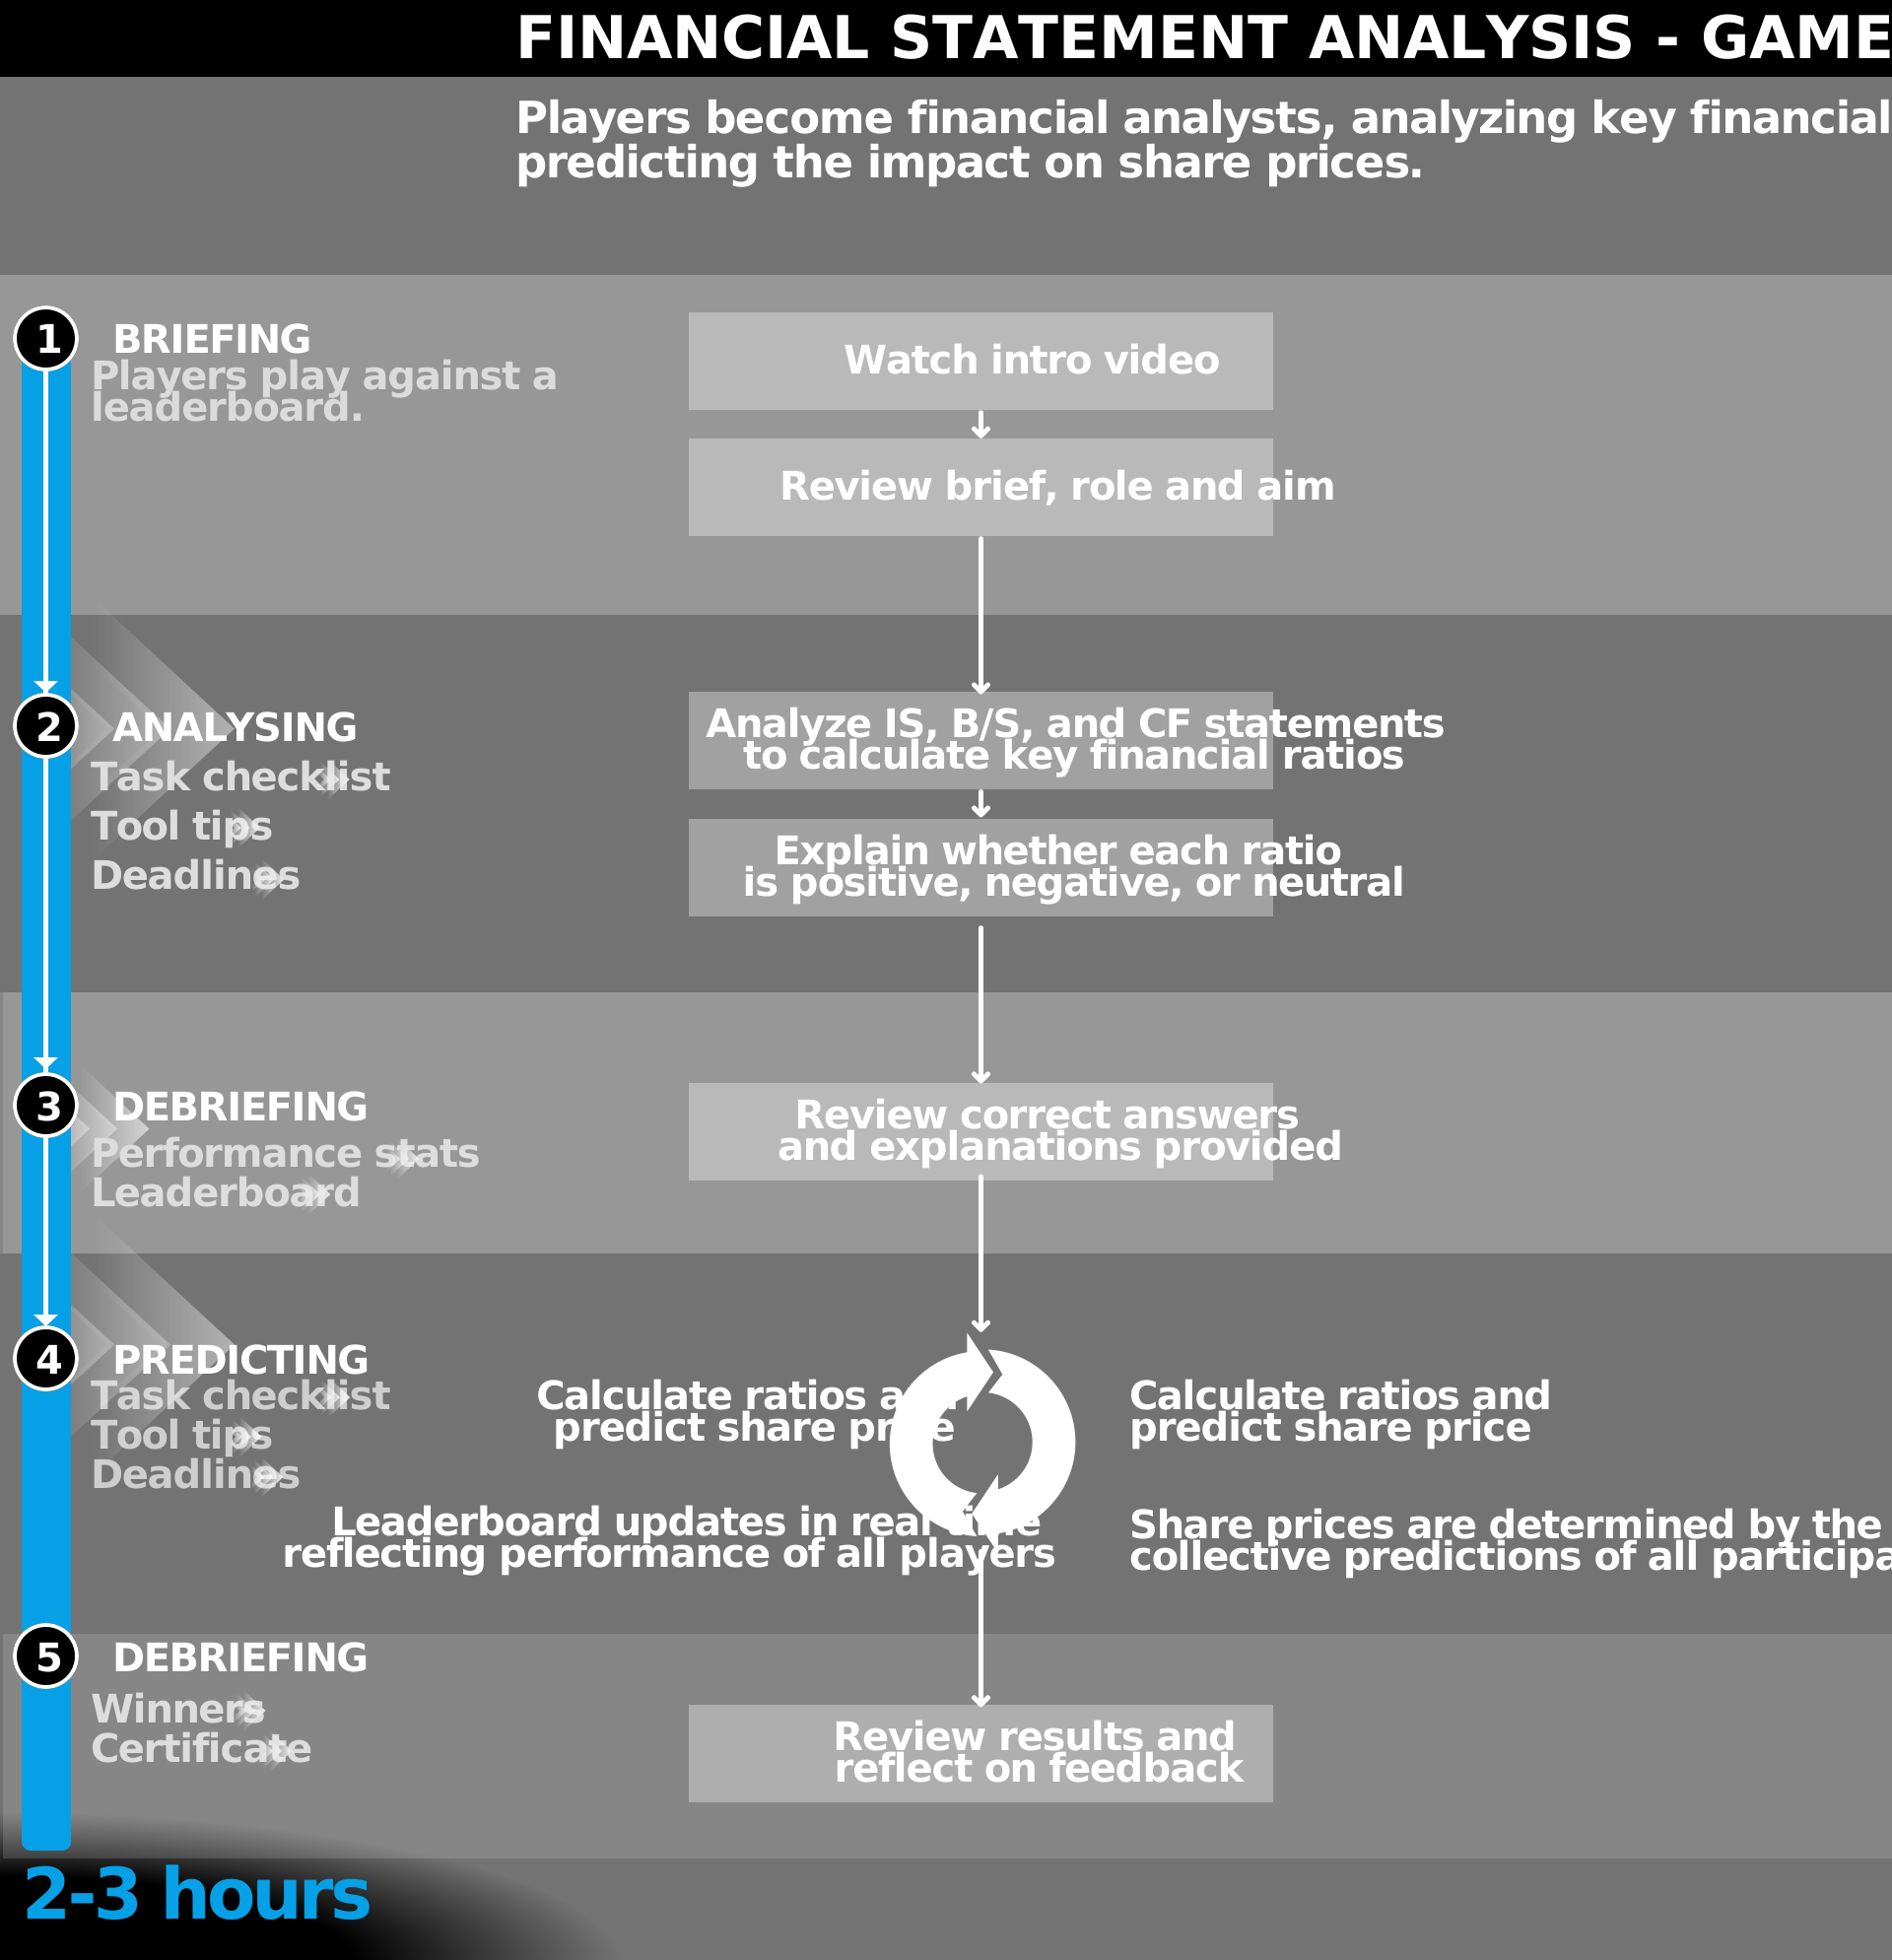
Once launched, the simulation leads students through the full activity in sequence. Professors can monitor progress and intervene when useful, without directing every task or providing continuous instruction.
The Professor Admin Panel brings timeline controls, participant management, guidance and live monitoring into one place. The Student Interface guides each participant from financial-statement analysis to a share price prediction.
The timeline shows the complete stage sequence and allocated timings. Professors can select a stage to move all participants to that point or use Adjust to change the time available.
The Admin Guide provides Setup & Facilitation guidance, Teaching Notes and the Gameflow Diagram. The First Time User Guide introduces the dashboard and student experience.
Play starts automatic progression. Pause holds the timer in the current stage. Stop locks student screens.
Students review their role as a Financial Analyst, understand the objective of assessing ChippyCo’s financial performance and identify the key ratio-analysis and share-price decisions they will make during the simulation.
Students review updated financial statements, company developments and new reports in each round, then decide whether the latest evidence changes their share price view.
The final Reflection view brings together the leaderboard, Share Distribution, Share Price History and Answers so students can compare outcomes and review mistakes.
Students receive quantitative and qualitative information about the company. The Financials & Ratios workbook provides the numerical evidence, while company reports, round descriptions and newsfeeds provide context for interpreting why the figures may be changing.
The workbook brings together the Income Statement, Balance Sheet and Cash Flow Statement, supplied formulas and a dedicated area for student calculations.
Management and individual commentary gives students qualitative context to compare with the reported results.

5 mins
The student intro video introduces the simulation, explains the Financial Analyst perspective and outlines the key stages and objectives. It helps students understand what to expect and builds confidence before the timed activity begins.
Assessment is optional. Professors may run the simulation as an ungraded applied activity or use the platform data as one source of assessment evidence. Simulation scores should support, rather than automatically replace, academic judgement.
The dashboard supports automatic progression, manual stage selection and adjustable timings. Coaching is optional, and the simulation can be paused and resumed across more than one teaching session.
Step 1
Add students through Player Management and confirm that they can access the simulation before the timed activity begins.
Step 2
Review the timeline, adjust individual stage durations where required and decide whether the activity will run in one session or across several sessions.
Step 3
Press Play to start the timer and automatic progression. Pause is useful for a short break or class-wide clarification. Stop halts the timer and locks student screens.
Step 4
Use Live Monitoring to review calculations and decisions. Intervene where students misunderstand the task or process, without directing them towards a preferred share price prediction.
Everything needed to prepare, run and debrief the Financial Statement Analysis simulation is organised within the resources below.
Option 1:
Run the simulation in a single session. You can pause the simulation to provide coaching if you want.
Option 2:
Split the simulation over 2 to 3 lectures. Stop the simulation at the end of a lecture and resume it at the beginning of the next.
These industry professionals were involved in the inception, creation, development, testing and optimisation of the simulation.

Investment banking experience across UBS, Morgan Stanley, and Deutsche Bank. Studied Mathematics at Saratov University.

Former Practice Specialist in McKinsey’s Corporate Finance team in Germany and Finance professor at Aberdeen University.

Worked in the finance department of Precomp Tools. Studied Engineering and holds an MSc in Corporate Finance from Bayes.

Assistant Professor of Finance at Tilburg University, teaching corporate finance courses. Also lectures at TIAS Business School.

Senior investment banker at Morgan Stanley with experience in M&A and TMT coverage across New York and San Francisco. Studied business at Kellogg.
During the call, we can: