Product profitability
Compare cost structures, contribution margins and break-even exposure.

Managerial Accounting Simulation
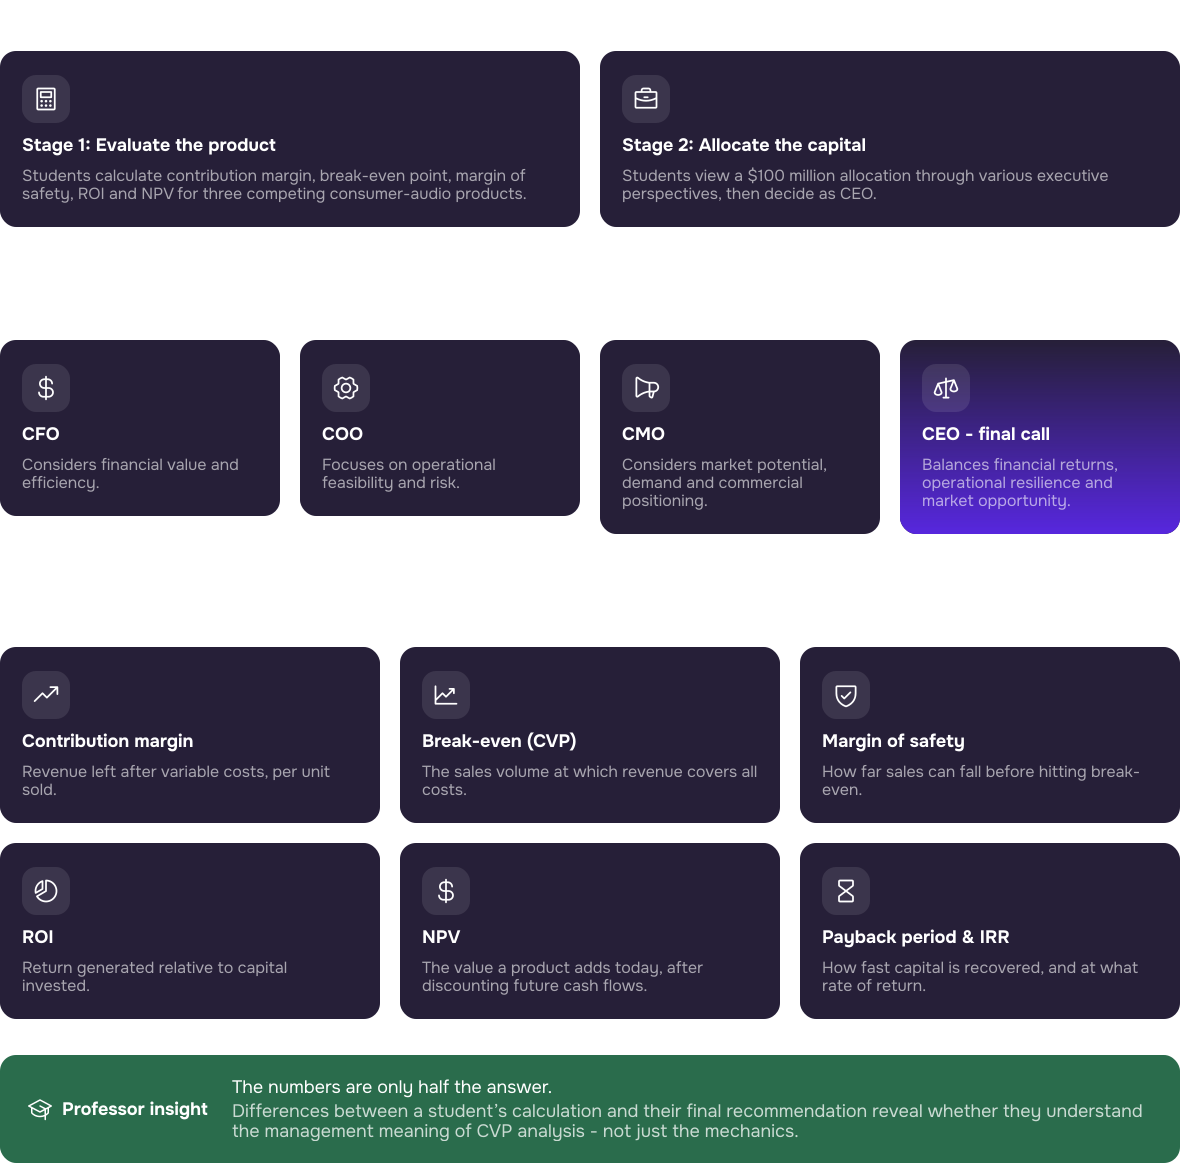
Students calculate contribution margin, break-even, margin of safety, ROI and NPV for three competing products, recommend one and justify it. They then allocate a fixed budget across opportunities from the CFO, COO and CMO perspectives before making the final CEO decision.
Because contribution margin, break-even, ROI and NPV rank the three products differently, the recommendation cannot be read off a single number.
Compare cost structures, contribution margins and break-even exposure.
Interpret ROI, NPV, margins and operating performance together.
Allocate a fixed budget across competing product opportunities.
Duration
Run the complete experience in one intensive session or divide its principal decision stages across two classes.
Format
Each participant enters their own calculations, choices, allocations and reasons, with cohort comparison at the output stages.
Level
Core teaching at undergraduate level; at postgraduate and MBA level the executive allocation stage carries most of the value.
Professor tools
Manage stage progression, adjust timings, pause delivery and communicate with participants.
Prerequisites
Suitable for beginners, with guidance, case information, video and interface instructions.
Delivery
The web-based simulation can also support independent homework within a professor-defined window.
Optional assessment
Use calculations, selections, allocations, written reasons and comparative outputs, or run it as an ungraded activity.
Syllabus Fit
Designed for Introduction to Finance, Financial Accounting, Managerial Accounting, Management Accounting, Corporate Finance and Financial Management
Contribution margin, break-even, ROI and NPV answer different questions, and the three products do not rank the same way on all of them. Students have to decide which measure should carry the decision, and say why.

It connects technical calculations to a decision that students must explain and defend.
Students calculate contribution margin, break-even, ROI and NPV, then decide how the measures should be interpreted when they point towards different product choices.
Students consider cost behaviour, contribution, operating exposure, return and market potential rather than selecting a product using one measure alone.
Calculations, selections, written rationales and capital allocations help professors compare technical accuracy, interpretation and decision quality.
The professor dashboard supports preparation, timing and delivery, while the student interface guides participants from product-level calculations to final capital allocation.
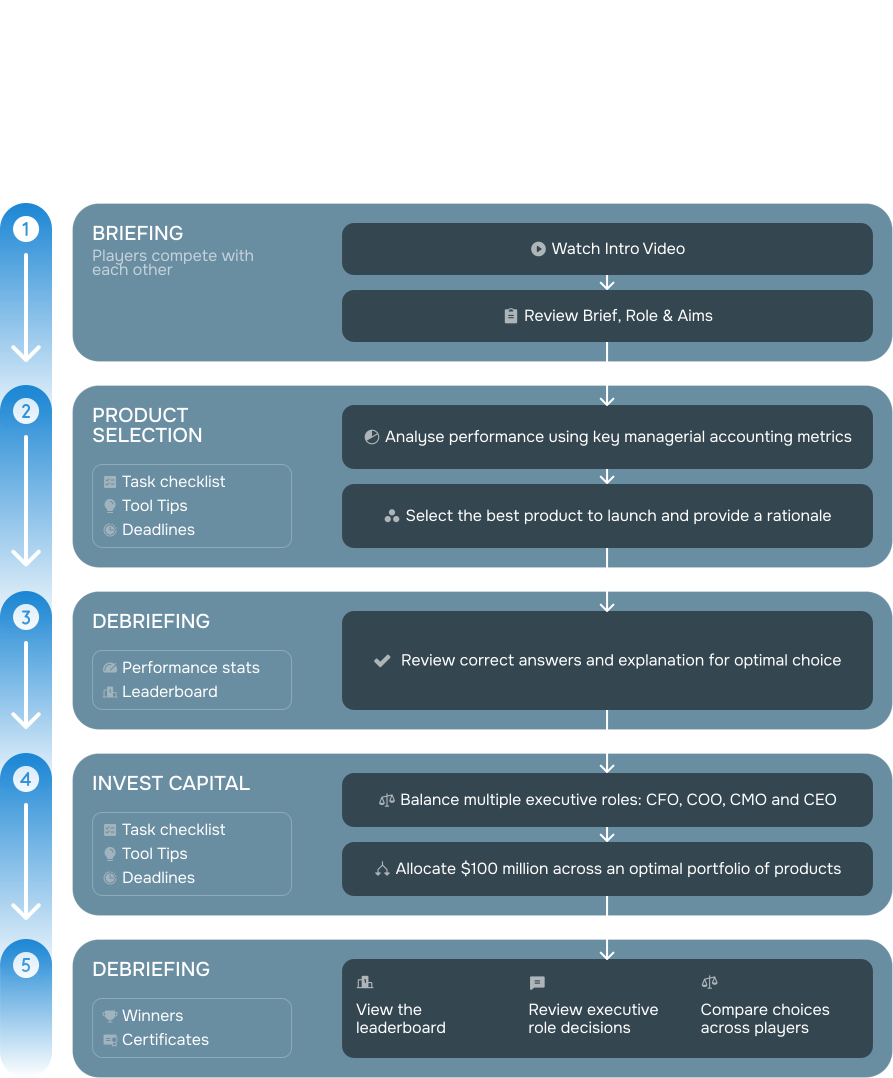
The Timeline displays the complete simulation sequence and its stage durations. Professors can adjust timings, start automatic progression or move every participant manually to a selected stage.
The Admin Guide provides access to Setup & Facilitation, Teaching Notes and the Gameflow Diagram. Player Management allows professors to manage participants and open an individual student view when access needs to be checked.
Play starts automatic progression. Pause holds the timer in the current stage. Stop locks student screens.
Students compare three products and enter the calculations needed to assess their viability. Confirmed measures include contribution margin, break-even, NPV, margin of safety and ROI.
Students compare five products with different investment requirements and performance measures. They work through CFO, COO and CMO perspectives before completing the final CEO allocation.
The output area brings together rankings, role-perspective decisions, products selected and recorded reasons. Students can move between Leaderboard, Outputs and Products views.
Students receive qualitative product information and quantitative financial evidence. They must connect product positioning and market assumptions with cost structures, operating performance and investment value.
Students review the product proposition, features, target market, selling price, variable costs, fixed-cost categories and sales forecast.
Students review projected income, expected cash flows and measures including discount rate, IRR, payback and profitability index.

4 mins
A short introduction that prepares students for the simulation by explaining the context, objectives, key stages and what they need to do before the timed activity begins.
Assessment is optional. Professors may run the simulation as an ungraded applied activity or use platform-generated calculations, decisions, reasons and comparative outputs as evidence within a wider assessment.
The platform data can support academic judgement, but simulation scores and rankings should not automatically replace it.
The simulation can progress automatically after it is started, or the professor can control the class manually through the Timeline. Coaching is optional.
Step 1
Use Player Management to add participants and confirm access before the timed activity. The professor can open an individual participant's Student Interface where a test is required.
Step 2
Review the default stage durations and use Adjust to fit the planned delivery format. Decide whether the simulation will run in one session or be divided after Product Selection Outputs.
Step 3
Press 'Play' to start the timer and automatic progression. 'Pause' is useful for a short break or class-wide clarification. 'Stop' halts the timer and locks student screens.
Step 4
Use student outputs, role filters and comparative results to identify calculation differences, decision patterns and contrasting capital allocations. Coaching is optional and should examine the process rather than reveal a preferred answer.
Everything needed to prepare, run and debrief the Managerial Accounting simulation is organised within the resources below.
The Managerial Accounting simulation is designed to be integrated into existing courses, either as in-classroom or as homework.
Option 1:
1.5 hours in one session. The Managerial Accounting simulation can be paused to allow short breaks. The facilitator may provide coaching during the simulation (optional).
Option 2:
Break up the simulation into smaller sessions:
• 3 x 30 min
• 2 x 45 min
The simulation for Managerial Accounting can be paused at the end of each session and resumed at the next one. The facilitator may provide coaching during the simulation (optional).
Option 3:
Students can complete the simulation as homework, with a set timeframe such as one day or one week determined by the facilitator.
Option 4:
Hybrid approach, beginning the simulation in a class setting and allowing students to finish it independently.
These industry professionals were involved in the inception, creation, development, testing and optimisation of the simulation.

Investment banking, capital markets, PE, and corporate ratings experience at Morgan Stanley, S&P, and HPS Investment Partners. Holds a PhD in Quantitative Finance.

Senior investment banker at Morgan Stanley with experience in M&A and TMT coverage across New York and San Francisco. Studied business at Kellogg.

Over 15 years of experience across advisory, PE, VC, family offices, and entrepreneurship. Covered M&A transactions from multiple angles and holds a PhD in Corporate Finance.

Worked in the finance department of Precomp Tools. Studied Engineering and holds an MSc in Corporate Finance from Bayes.
During the call, we can: