It is designed for business students, finance trainees, early-career analysts, and any professional needing to understand or use financial statements to make decisions.

Ratio Analysis Simulation
In this Ratio Analysis Simulation, participants step into the role of financial analysts to dissect company performance, diagnose financial health, and make strategic recommendations by mastering the art and science of financial ratios.

Ratio Analysis Simulation Overview
The Ratio Analysis Simulation is an interactive, scenario-based learning tool designed to transform abstract financial concepts into tangible decision-making skills. Participants are immersed in the dynamic role of a financial analyst or consultant. Presented with the complete financial statements of competing companies, the task is to navigate through profitability, liquidity, solvency, and efficiency metrics to uncover underlying business strengths, weaknesses, and risks.
Each round introduces new market developments, management decisions, or economic shifts that directly impact the companies' financials. Participants must calculate key ratios, interpret trends against industry benchmarks, and synthesize their findings into clear, actionable insights for stakeholders. This simulation moves beyond calculations to emphasize critical thinking, strategic storytelling with data, and the practical application of ratio analysis in real-world contexts such as credit assessments, investment decisions, and performance reviews.
It is ideal for undergraduate and graduate business programs, corporate finance training, and professional certification prep courses, providing a risk-free environment to build confidence and competence in financial analysis.

Ratio Analysis Simulation Concepts
Participants work through realistic scenarios, which can be customized to emphasize or exclude specific topics depending on the learning goals. This modular structure allows the simulation to be tailored to any type of session. Key concepts include:
- Profitability Analysis
- Liquidity Assessment
- Solvency and Leverage
- Efficiency and Activity
- Market Valuation Metrics
- DuPont Analysis
- Trend Analysis and Benchmarking
- Integrating Qualitative and Quantitative Factors

Gameflow
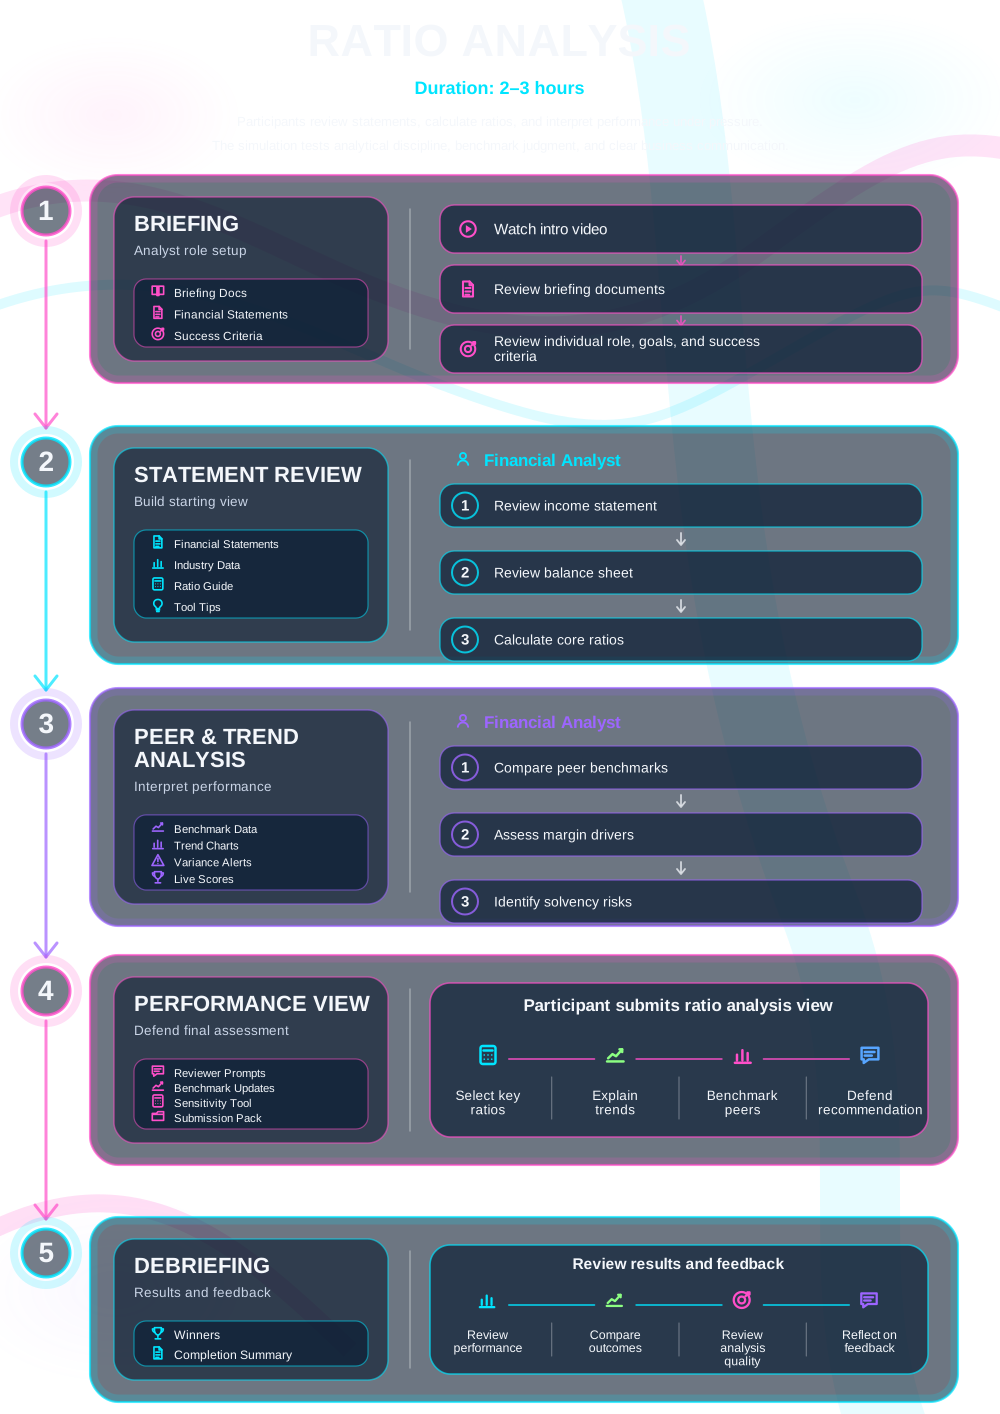

What Participants Do
In the simulation, participants will:
- Analyze real-world style income statements, balance sheets, and cash flow statements.
- Calculate a comprehensive suite of financial ratios across multiple periods.
- Interpret results to diagnose financial stability, operational efficiency, and profitability.
- Benchmark company performance against competitors and industry standards.
- Prepare and deliver clear, concise reports or presentations summarizing their findings and recommendations.
- Respond to new information and make forecasts about future company performance.

Learning Objectives
By the end of the simulation, participants will be able to:
- Calculate and interpret the major financial ratios used in business analysis.
- Synthesize data from all three financial statements to form a coherent view of a company's health.
- Identify red flags and strengths within a business using quantitative evidence.
- Communicate complex financial insights effectively to non-financial stakeholders.
- Apply ratio analysis to support practical decisions in lending, investing, or management.
- Develop critical thinking and diagnostic skills for financial problem-solving.
How the Ratio Analysis Simulation Works
This simulation can be run individually or in teams in academic or corporate contexts. Each cycle represents a stage of getting through a pressing financial situation.
1. Introduction and Company Assignment Participants receive a background briefing and are assigned to analyze one or more companies.
** 2. Financial Data Review** They access a dedicated dashboard containing several years of financial statements for their assigned companies.
3. Analysis and Calculation Phase Using provided tools, participants calculate key ratios and plot trends.
4. Scenario Injection A new round begins with market news (a recession, new competitor, supply chain issue) that impacts the next set of financials.
5. Strategic Decision and Reporting Based on their updated analysis, participants draft an analyst report, create a summary dashboard, or prepare a client presentation with recommendations.
6. Debrief and Feedback The facilitator leads a review session, comparing team insights, discussing correct interpretations, and linking outcomes to real-world consequences. Performance analytics from the simulation platform can highlight areas of strength and misunderstanding.
Frequently Asked Questions
Assessment
Assessment of participant performance can be tailored according to the host institution’s objectives (business school, corporate training, assessment centre). Typical assessment criteria include:
- Correct calculation of financial ratios.
- Quality of interpretation, trend identification, and benchmarking.
- Relevance and justification of recommendations based on the analysis.
- Clarity, structure, and persuasiveness of the final report or presentation.
- Using built-in tools for reflective learning and peer evaluation within teams.