It's ideal for finance and economics students, aspiring research analysts, traders, portfolio managers, and any professional who needs to understand how economic data drives financial markets.

Financial Market Indicators Simulation
In this Financial Market Indicators Simulation, participants and tasked with interpreting complex economic signals to guide investment decisions, manage portfolio risk, and navigate volatile market conditions.

Financial Market Indicators Simulation Overview
Participants are immersed in a dynamic trading floor environment where success depends on accurately reading and acting upon a constant stream of economic data. Each simulation round presents new market scenarios driven by changing indicators—shifts in inflation reports, employment data, central bank announcements, GDP revisions, and geopolitical events.
They must synthesize information from leading, lagging, and coincident indicators to forecast market movements, adjust asset allocations, and communicate strategy rationales to stakeholders. The simulation emphasizes analytical rigor and decision-making under pressure, blending quantitative data interpretation with an understanding of market psychology and macroeconomics.
This simulation is ideal for finance students, analysts-in-training, and professionals seeking to sharpen their ability to translate economic data into actionable trading and investment strategies, demonstrating how real-world market moves are often precipitated by shifts in underlying indicators.

Financial Market Indicators Simulation Concepts
Participants work through realistic scenarios, which can be customized to emphasize or exclude specific topics depending on the learning goals. This modular structure allows the simulation to be tailored to any type of session. Key concepts include:
- Types of Economic Indicators
- Central Bank Policy and Interest Rates
- Inflation Metrics and Purchasing Power
- Employment and Consumer Health Data
- GDP and Business Cycle Analysis
- Market Volatility and Risk Gauges
- Sector-Specific Indicators
- Geopolitical and Sentiment Analysis
- Inter-Market Relationships
- Portfolio Strategy Adjustment

Gameflow
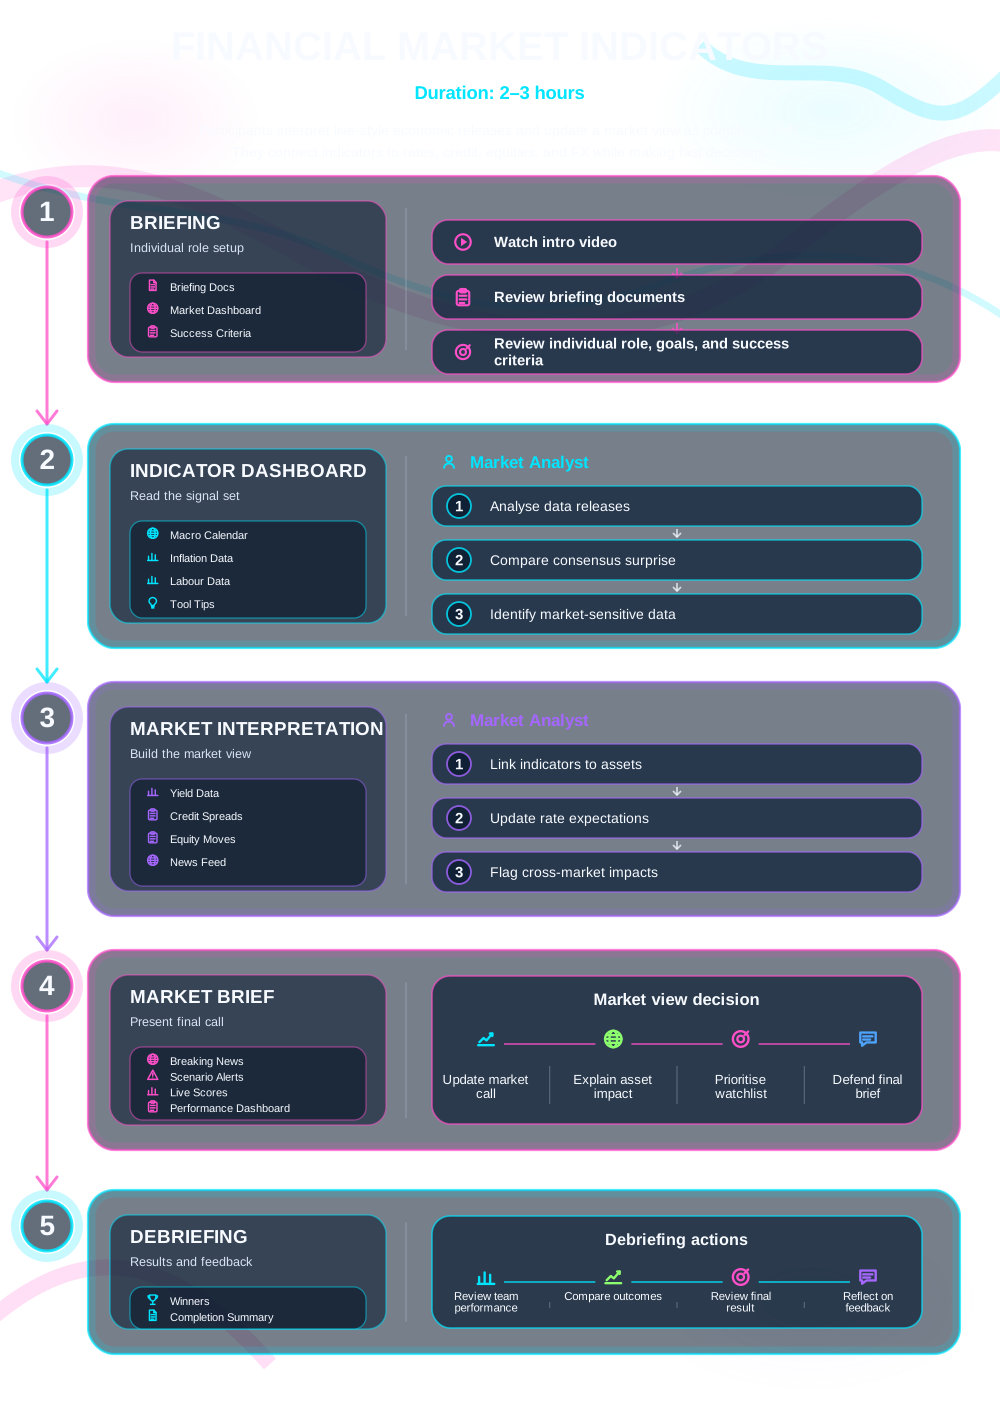

What Participants Do
In the simulation, participants will:
- Analyze real-time dashboards of incoming economic data releases and news headlines.
- Interpret the magnitude and market consensus vs. reality of key indicator reports.
- Forecast probable impacts on various asset classes (equities, bonds, forex, commodities).
- Construct and adjust model portfolios based on their macroeconomic outlook.
- Manage risk exposure by rebalancing in anticipation of or in reaction to data shocks.
- Pitch their market outlook and strategy adjustments to a simulated investment committee.
- Compete or collaborate with peers to achieve superior risk-adjusted returns.
- Reflect on the accuracy of their forecasts and the effectiveness of their strategies.

Learning Objectives
By the end of the simulation, participants will be able to:
- Identify and categorize key macroeconomic indicators and understand their significance for financial markets.
- Analyze and interpret the potential market impact of new economic data releases.
- Formulate a coherent market outlook and investment thesis based on a set of economic indicators.
- Adjust portfolio strategy and asset allocation in response to changing macroeconomic conditions.
- Communicate complex economic insights and strategy rationales clearly to stakeholders.
- Manage portfolio risk in environments of economic uncertainty and data volatility.
- Understand the interconnectedness of global economies and their indicators.
- Develop confidence in making time-sensitive financial decisions backed by data analysis.
How the Financial Market Indicators Simulation Works
This simulation can be run individually or in teams in academic or corporate contexts. Each cycle represents a stage of getting through a pressing financial situation.
1. Receive a Market Brief and Data Participants are introduced to the current economic backdrop and receive a stream of new indicator releases.
** 2. Analyze the Data** They assess the data, compare it to forecasts, and gauge its implications for inflation, growth, and policy.
3. Make Strategic Decisions Participants adjust their portfolio holdings, allocating across asset classes, sectors, and geographies.
4. Collaborate or Compete Teams may debate interpretations, present opposing theses, or act as an analyst firm presenting to client portfolios.
5. Communicate Outcomes Participants deliver a concise market update or investment memo justifying their decisions.
6. Review and Reflect Feedback highlights portfolio performance, the accuracy of their forecasts, and the quality of their strategy rationale. Participants refine their analytical approach in subsequent rounds.
Frequently Asked Questions
Assessment
Assessment of participant performance can be tailored according to the host institution’s objectives (business school, corporate training, assessment centre). Typical assessment criteria include:
- The risk-adjusted performance of their model portfolio.
- The accuracy and logic of their economic forecasts and data interpretation.
- The strategic appropriateness of their portfolio adjustments in response to new data.
- The clarity, persuasiveness, and professionalism of their investment communications (memos or presentations).