No. The simulation is designed to be intuitive, teaching fundamental concepts through hands-on doing. The provided data and interface guide all participants toward effective learning.

Data-Driven Marketing Budget Allocation Simulation
Marketing success is no longer about gut feelings; it's about data. This simulation tasks participants with maximizing Return on Investment by strategically allocating a limited budget across a dynamic digital and traditional marketing mix.

Data-Driven Marketing Budget Allocation Simulation Overview
The Data-Driven Marketing Budget Allocation Simulation provides an experience sharpening analytical skills. Participants are placed in charge of a company's marketing department and given a fixed budget for a simulated fiscal period.
They must analyze historical performance data, market research, and competitive intelligence to make critical investment decisions across various channels such as Social Media, Search Engine Optimisation (SEO), Email Marketing, Content Creation, and Traditional Advertising.
Each decision impacts KPIs like brand awareness, customer acquisition cost, lead generation, and ultimately, company revenue and profit. Through multiple rounds participants learn to optimize their spending, adapt to market shifts, and justify their strategic choices based on hard data.

Data-Driven Marketing Budget Allocation Simulation Concepts
Participants work through realistic scenarios, which can be customized to emphasize or exclude specific topics depending on the learning goals. This modular structure allows the simulation to be tailored to any type of session. Key concepts include:
- Marketing Mix Modeling (MMM)
- Return on Investment (ROI) and Return on Ad Spend (ROAS)
- Customer Acquisition Cost (CAC) & Customer Lifetime Value (LTV)
- Multi-Touch Attribution Modeling
- Budget Constraint Optimization
- Brand Equity & Awareness Metrics
- A/B Testing and Experimentation
- Market Saturation and Diminishing Returns
- Competitive Analysis and Market Share
- Data Visualization and KPI Dashboarding

Gameflow
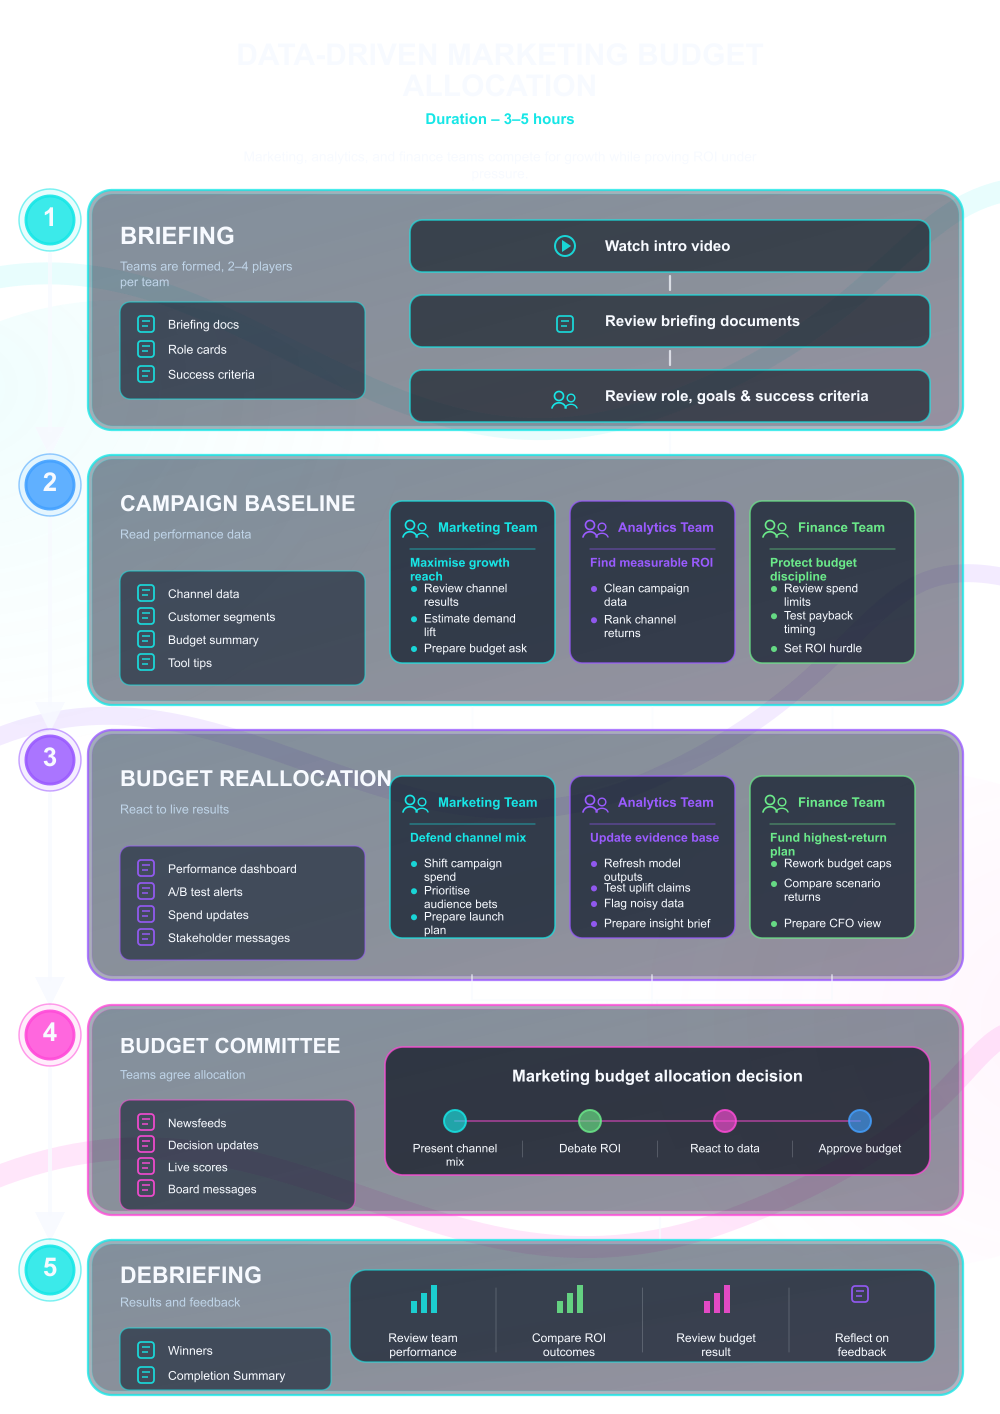

What Participants Do
In the simulation, participants will:
- Analyze a dashboard of past performance data for various marketing channels.
- Allocate a finite quarterly budget across 8-10 different marketing channels.
- Set specific campaign goals and target KPIs for each allocation.
- React to unexpected market events, competitor moves, and changes in channel effectiveness.
- Interpret the results of their decisions through a detailed performance report after each simulated quarter.
- Adjust their strategy based on data-driven insights to improve outcomes in subsequent rounds.
- Present a final marketing plan and budget justification to the "board" (instructors or peers), defending their strategic choices.

Learning Objectives
By the end of the simulation, participants will be able to:
- Articulate the relationship between marketing spend, channel performance, and overall business profitability.
- Analyze complex data sets to identify the most and least effective marketing channels.
- Optimize a multi-channel marketing budget under constraints to maximize key metrics like ROI, ROAS, and lead volume.
- Evaluate the impact of external factors and competitive actions on marketing strategy.
- Synthesize performance data into a coherent narrative to justify past actions and future budget requests.
- Build a scalable framework for making ongoing, data-driven marketing decisions.
How the Data-Driven Marketing Budget Allocation Simulation Works
This simulation can be run individually or in teams in academic or corporate contexts.
1. Receive and Analyze the Brief Participants are briefed on the company, its products, the competitive landscape, and the simulation interface
2. Plan and Strategize Using historical data and financial models, teams make their initial budget allocations and set their strategic goals.
3. Manage Finances and Team Dynamics The simulation engine processes the decisions, incorporating elements like market randomness and competitor team’s decisions. Teams receive a detailed quarterly report showing their performance against KPIs.
4. Adapt and Change Up the Strategy Armed with results from the previous round—and often facing new market scenarios—teams re-allocate their remaining budget to correct mistakes and capitalize on opportunities.
5. Debrief and Present The session concludes with a guided debrief where teams present their final strategy, results, and key learnings.
Frequently Asked Questions
Assessment
Assessment of participant performance can be tailored according to the host institution’s objectives (business school, corporate training, assessment centre). Typical assessment criteria include:
- Accuracy in judgement of company’s assets and quality of assumptions and adjustments
- Depth and logic of scenario analysis and sensitivity ranges
- Clarity, coherence, and persuasiveness of the valuation memo and presentation
- Ability to adapt and revise valuations in light of news shocks or changes
- Collaboration, division of work, integration of roles, and final coherence
- Rating by peers and self-reflection on approach and decisions
Assessment may incorporate peer and self-review components, facilitator scoring, and debrief discussion. Results may feed into grades, executive feedback, certification or development plans.