Intense, real-world, memorable - gamified simulation training
Intense, real-world, memorable - gamified simulation training

In this hands-on Sensitivity Analysis Training, participants evaluate how changes in key inputs impact financial outcomes. They learn to pinpoint high-impact variables, test assumptions, and support better business decisions with data.
Driver-Based Modeling: Identifying the most influential input variables
Sensitivity Tables: One-variable and two-variable impact tables
Tornado Diagrams: Visualizing variable impact hierarchies
What-If Analysis: Testing risk exposure across different assumptions
Decision Impact: Linking assumptions to KPIs such as ROI, margin, NPV, or earnings
Scenario Comparison: Contrasting sensitivity results with scenario-based approaches
Communication of Results: Presenting insights clearly to decision-makers
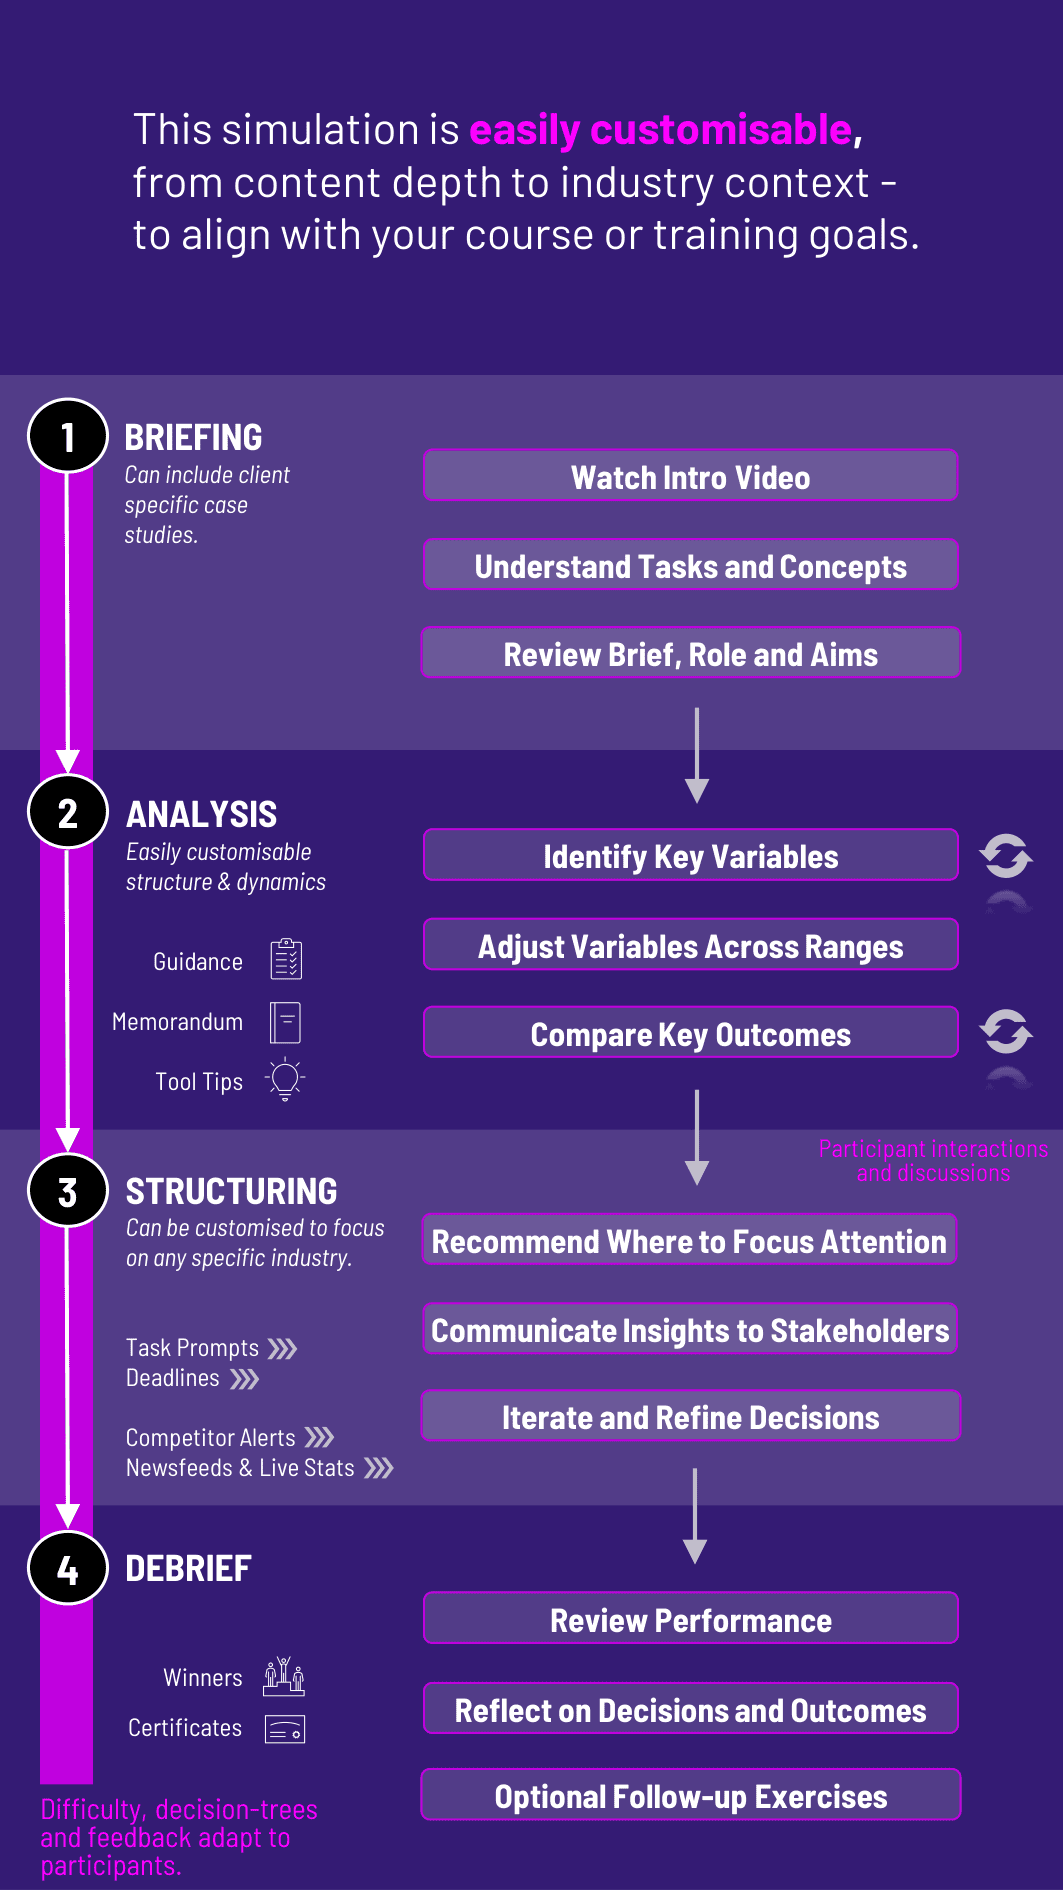
Identify 3 - 5 high-impact input variables
Adjust each variable independently across defined ranges
Track and compare how each change affects key outcomes
Use visuals (tables, charts) to summarize variable impact
Recommend where to focus attention, mitigate risks, or seek further data
Communicate insights in a memo or presentation to senior stakeholders
Iterate and refine decisions as new data or constraints emerge
By the end of the training, participants will be more confident in:
Building and interpreting sensitivity tables and tornado charts
Understanding which variables have the biggest impact on financial outcomes
Using sensitivity analysis to strengthen forecasts and investment cases
Supporting business decisions with data, not guesswork
Communicating assumptions and trade-offs clearly and persuasively
Distinguishing between sensitivity and scenario analysis (and using both effectively)
Responding to stakeholder questions about uncertainty and risk
Making data-driven recommendations under pressure
The training’s flexible structure ensures that these objectives can be calibrated to match the depth, duration, and focus areas of each program in corporate learning.
1. Receive a Case Brief Participants are given a business decision, model, or investment plan - along with base-case data.
2. Identify Key Input Drivers They determine which variables (e.g., sales volume, cost, interest rates) matter most to the decision.
3. Run Sensitivity Tests Participants use training tools (and Excel) to systematically vary one input at a time and observe the financial impact.
4. Interpret Results They summarize which variables had the biggest effect and what thresholds or breakpoints emerge.
5. Make a Recommendation Based on insights, they advise whether to proceed, pause, or gather more information - framing both the upside and risk.
6. Respond to Stakeholders Further rounds introduce board feedback, new constraints, or alternate assumptions to test further.
Is prior Excel or modeling experience required? Not necessarily. The training provides guided support and can be tailored for different skill levels.
How is this different from scenario analysis? Scenario analysis tests combinations of inputs. Sensitivity analysis tests one variable at a time to isolate its specific impact.
Can this be used in corporate finance or valuation courses? Yes. It's particularly useful for investment decision-making, capital budgeting, and business planning.
Are visual outputs included? Yes. Participants work with and interpret sensitivity tables, tornado charts, and break-even points.
Is this suitable for teams? Yes. Teams can collaborate on driver selection, analysis, and final presentations - mirroring real-world settings.
How long is the training? It can run in 3 - 4 hours for a short course or be extended into a full-day workshop with multiple rounds.
Can I use real industry examples? Yes. The training can be adapted for sectors like energy, consumer goods, tech, or finance.
Are stakeholder communication tasks included? Yes. Participants must summarize and defend their analysis to a mock leadership team.
How is performance measured? By the logic of the analysis, clarity of interpretation, realism of recommendations, and communication quality.
Does it integrate into finance or data analytics tracks? Absolutely. It works seamlessly in courses or trainings focused on analytics, FP&A, or investment analysis.
Accuracy and clarity of sensitivity tables and charts
Appropriateness of variable selection
Strength and realism of recommendations
Clarity in summarizing results for decision-makers
Responsiveness to new data or feedback
Written and/or verbal communication (e.g., investment memos, board briefings)
Professors and corporate trainers can customize the format to include peer review, individual performance metrics, and reflection exercises.
Join this 20-minute webinar, followed by a Q&A session, to immerse yourself in the training.
or
Book a 15-minute Zoom demo with one of our experts to explore how the training can benefit you.