Intense, real-world, memorable - gamified simulation training
Intense, real-world, memorable - gamified simulation training

Participants turn raw financial and operational data into clear, actionable insights - identifying trends, testing hypotheses, and driving decisions - in our Data Analysis Course.
Exploratory Data Analysis (EDA): Identifying patterns, outliers, and trends
Descriptive Statistics: Mean, median, variance, standard deviation
Data Cleaning and Transformation: Dealing with missing values, noise, and inconsistencies
Correlation and Causation: Testing relationships and identifying spurious conclusions
Segmentation and Filtering: Customer profiling, cohort analysis, and performance grouping
Data-Driven Storytelling: Presenting insights using charts, dashboards, and memos
Decision Support: Recommending actions based on analytical findings
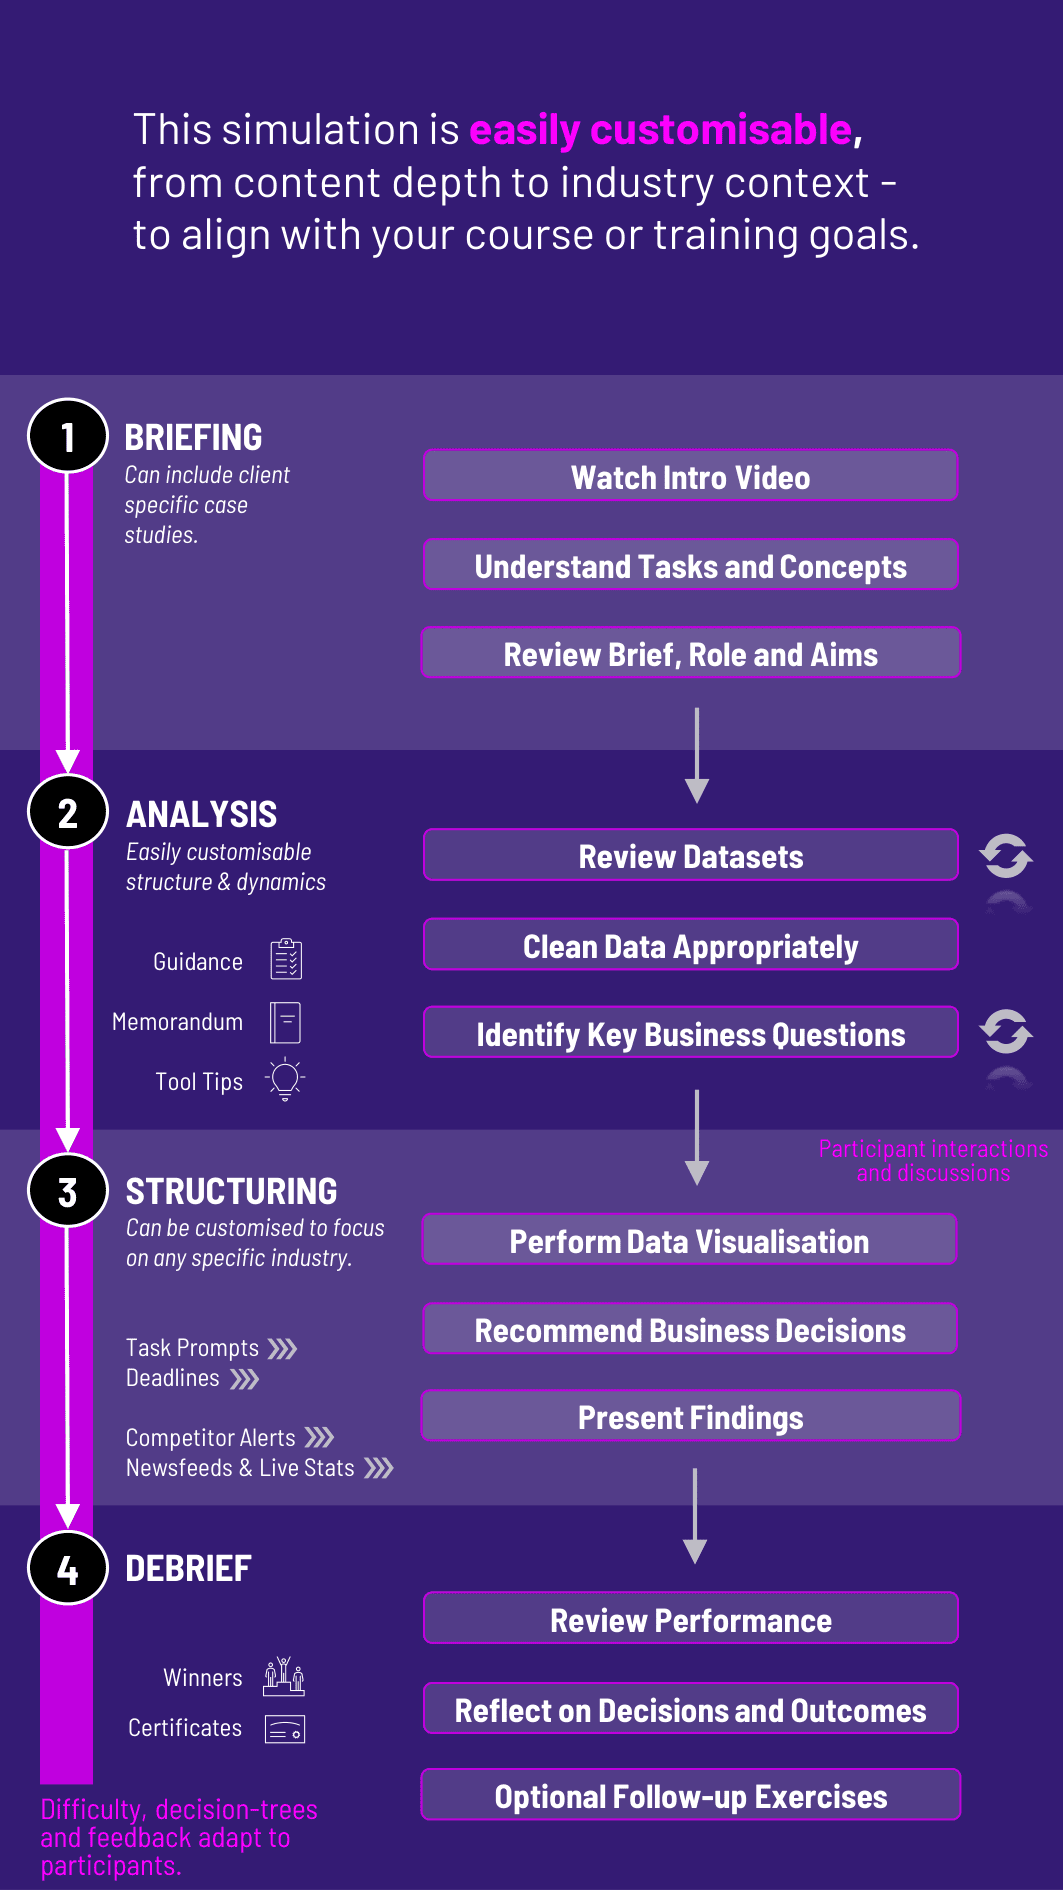
Receive raw financial, customer, and operational datasets
Identify key business questions and clean the data appropriately
Apply statistical techniques to generate insights and detect anomalies
Segment and visualize data to tell a coherent story
Recommend specific business decisions (e.g. product focus, pricing, investment)
Present findings in written memos, dashboards, or debrief presentations
This course trains participants to use data in real business contexts. They learn how to:
Move from data collection to decision-making
Interpret charts and statistical results to support real-world recommendations
Communicate data-driven stories clearly and persuasively
Recognize the limits of data and the risks of overconfidence or bias
Apply analytical frameworks without overcomplicating the process
Build confidence in making decisions with imperfect information
**Do participants need programming or Excel skills? No coding is required. The course uses an intuitive interface with built-in charts and filters. Familiarity with spreadsheets is helpful but not mandatory.
**Is the course quantitative or qualitative? It blends both. While analysis is quantitative, the emphasis is on interpreting data to support business decisions, not technical modeling.
**Can instructors customize the data sets? Yes. We offer course focused on different domains (marketing, finance, operations) and can tailor datasets to fit specific learning goals.
**What is the course length? A full cycle can be completed in 2 - 3 hours, or extended across multiple sessions to allow deeper reporting and strategy development.
**How is performance assessed? Based on insight quality, recommendation clarity, communication effectiveness, and alignment with business context - not just technical correctness.
Join this 20-minute webinar, followed by a Q&A session, to immerse yourself in the course.
or
Book a 15-minute Zoom demo with one of our experts to explore how the course can benefit you.